Self-Learning-Based Joint Super-Resolution and Deblocking for a Highly
Compressed Image
-Experiments Analysis and Discussion
|
In this page, we analyze our experiments to summarize the effectiveness
and weakness of our method as follows:
|
Experiments Analysis
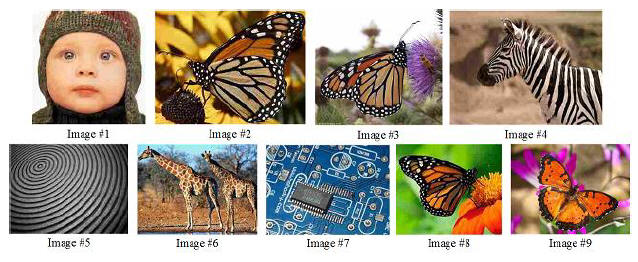
Fig.
1. Our image dataset.
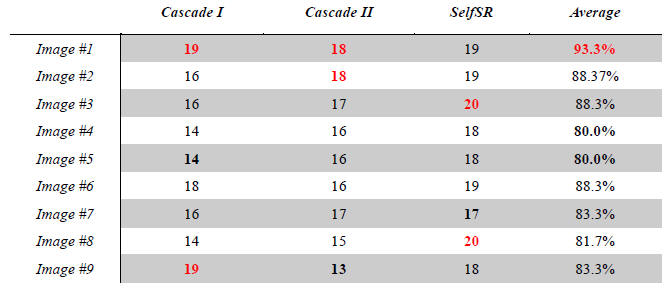
Table
1. Winning Frequency Matrix of Subjective Paired Comparisons for our
method between Self-Learning SR (SelfSR), BM3D+SelfSR, and SelfSR+BM3D for each
image.
Table
2. Winning Frequency Matrix of Subjective Paired Comparisons for our method
between Sparse Coding SR (SCSR), BM3D+ SCSR, and SCSR+BM3D for each image.
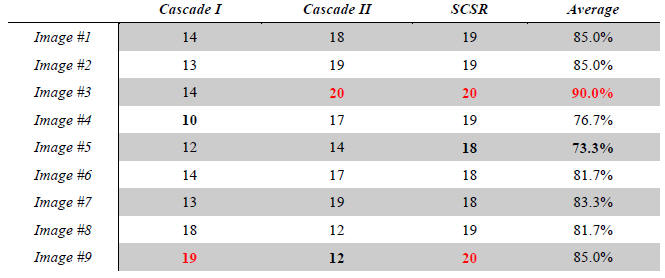
In
order to analyze our method, we list the subjective score for each image as
Table 1 and 2. The highest votes for paired comparison between our method and
comparative method is indicated in red and bold font, while the lowest votes is
indicated in black and bold font. It is remarkable that the test image with
lowest votes for two proposed methods is image #5. On the other
hand, the test images with highest votes are respectively image #1 and
#3.
Table
3. Image Attributes of our dataset.
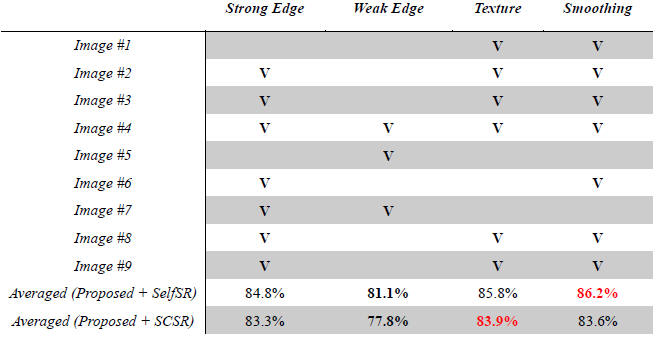
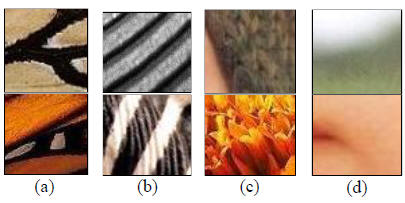
Fig.
2.
An example for image attributes. (a) Strong edge. (b) Weak edge (vertical
wrinkles in bottom side). (c) Texture. (d) Smoothing region .
Moreover, we specified four image attributes for our dataset to obtain further analysis, as shown in Fig. 2 and Table 3. An image could have one or more attributes simultaneously. Image with strong edges indicates that the edges in image is high contrast and sharpness, while image with weak edge is relevantly less sharp edge. From Table 3, we can observe that the highest votes for paired comparison between our method and others present in smoothing and texture attributes for our methods with selfSR and SCSR respectively. Similarly, image #1 and #3 consist of these two attributes, which also show the highest votes for the subjective test. On the other hand, the lowest votes for paired comparison is shown in weak edge attributes. In our dataset, image #5, which has the attribute of weak edge, also presents lowest votes for paired comparison between our method and others.
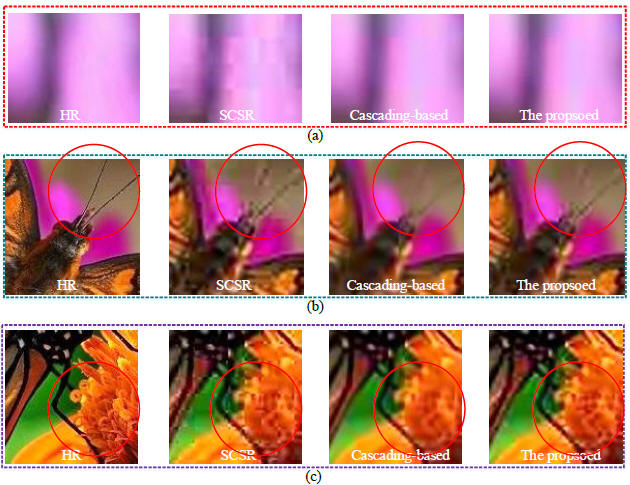
Fig.
3.
SR results on different kinds of image regions: (a) smooth region; (b) region
with strong edges; and (c) region with fine texture structure.