
Visualized Results for NRID
Our database: 35 test images
Visualized Results for Geometric Distortion
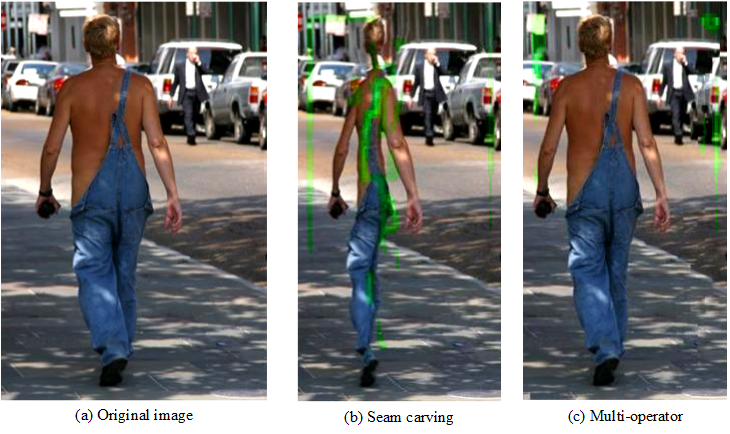
Fig. 1. The visualized distortion result using PGD metric only.
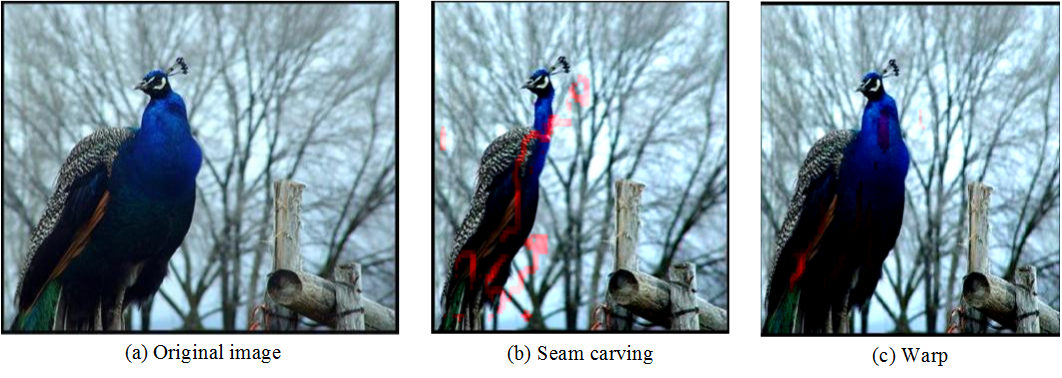
Fig. 2. The visualized distortion result using PGD metric only.
Visualized Results for Information Loss
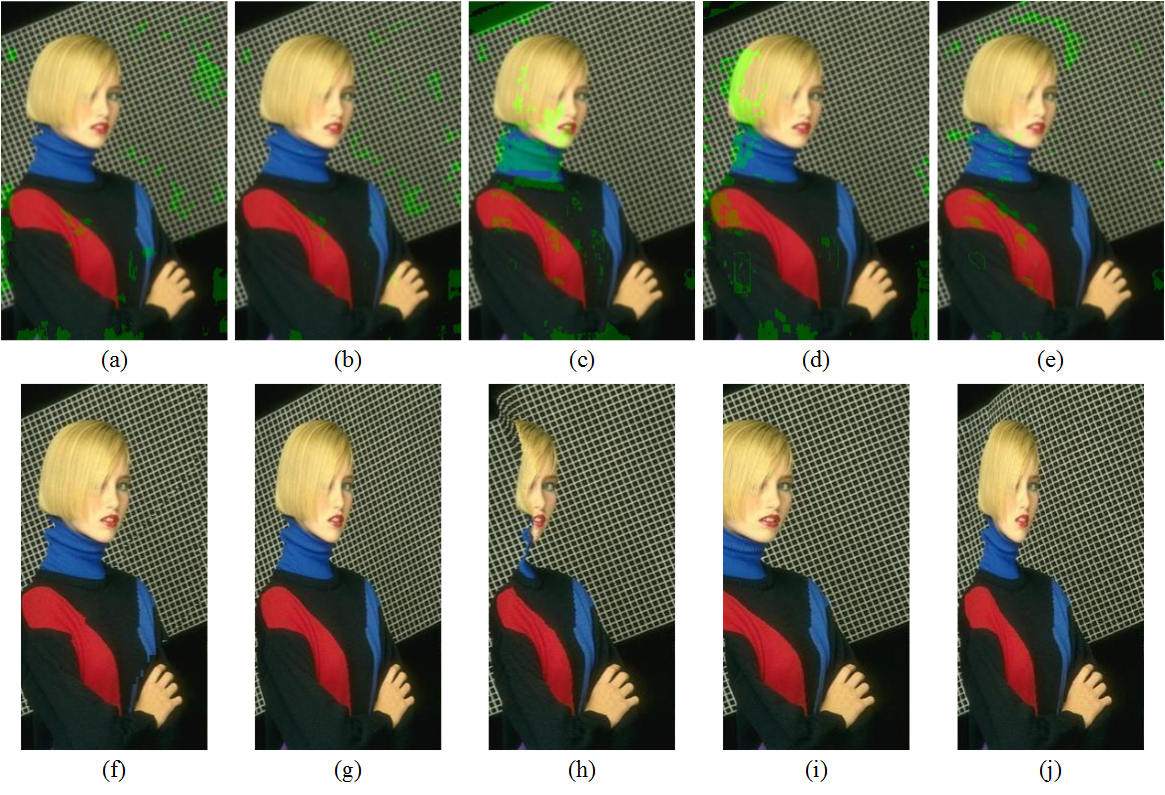
Fig. 3. The visualized information loss images. (a) to (e) respectively represent the information loss maps of the retargeted image generated by (a)(f) multi-operator, (b)(g) scaling, (c)(h) seam carving, (d)(i) shift-map, and (e)(i) warp algorithms.
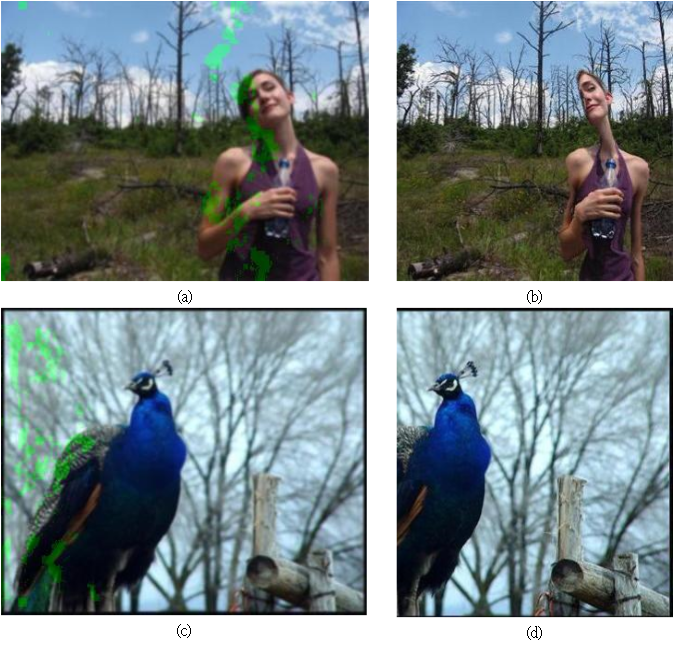
Fig. 4. The visualized information loss images. (a) the information loss map for the retargeted image (b) generated by seam carving. (c) the information loss map for the retargeted image (d) generated by shift-map.